About HEC About HEC
Summer School Summer School
Faculty & Research Faculty & Research
Master’s programs Master’s programs
Bachelor Programs Bachelor Programs
MBA Programs MBA Programs
PhD Program PhD Program
Executive Education Executive Education
HEC Online HEC Online
About HEC
Overview Overview
Who
We Are
Who
We Are
Égalité des chances Égalité des chances
HEC Talents HEC Talents
International International
Sustainability Sustainability
Diversity
& Inclusion
Diversity
& Inclusion
The HEC
Foundation
The HEC
Foundation
Campus life Campus life
Activity Reports Activity Reports
Summer School
Youth Programs Youth Programs
Summer programs Summer programs
Online Programs Online Programs
Faculty & Research
Overview Overview
Faculty Directory Faculty Directory
Departments Departments
Centers Centers
Chairs Chairs
Grants Grants
Knowledge@HEC Knowledge@HEC
Master’s programs
Master in
Management
Master in
Management
Master's
Programs
Master's
Programs
Double Degree
Programs
Double Degree
Programs
Bachelor
Programs
Bachelor
Programs
Summer
Programs
Summer
Programs
Exchange
students
Exchange
students
Student
Life
Student
Life
Our
Difference
Our
Difference
Bachelor Programs
Overview Overview
Course content Course content
Admissions Admissions
Fees and Financing Fees and Financing
MBA Programs
MBA MBA
Executive MBA Executive MBA
TRIUM EMBA TRIUM EMBA
PhD Program
Overview Overview
HEC Difference HEC Difference
Program details Program details
Research areas Research areas
HEC Community HEC Community
Placement Placement
Job Market Job Market
Admissions Admissions
Financing Financing
FAQ FAQ
Executive Education
Home Home
About us About us
Management topics Management topics
Open Programs Open Programs
Custom Programs Custom Programs
Events/News Events/News
Contacts Contacts
HEC Online
Overview Overview
Executive programs Executive programs
MOOCs MOOCs
Summer Programs Summer Programs
Youth programs Youth programs
Analytics in the Era of Big Data: Opportunities and Challenges - @Fotolia-shanghainesewang

Data Analytics

This special issue of Knowledge@HEC highlights several research projects and teaching initiatives at HEC Paris in the context of big data and business analytics. Nowadays it does not take much to convince students or managers alike of the importance of data for businesses. As Wedel and Kannan (2016) put it, “data is the oil of the digital economy”. Indeed, data is completely transforming organizations, and data-driven decision making is becoming more and more a part of a company’s core. In an increasing digital world, all of us are walking data generators, leaving long data trails: we have more data on everything.

Structure

Part 1
Analytics in the Era of Big Data: Opportunities and Challenges
This special issue of Knowledge@HEC highlights several research projects and teaching initiatives at HEC Paris in the context of big data and business analytics. Nowadays it does not take much to convince students or managers alike of the importance of data for businesses. As Wedel and Kannan (2016) put it, “data is the oil of the digital economy”. Indeed, data is completely transforming organizations, and data-driven decision making is becoming more and more a part of a company’s core. In an increasing digital world, all of us are walking data generators, leaving long data trails: we have more data on everything.
Part 2
En Route For The “Sexiest Job Of The 21st Century"?
Big data has been a key challenge for many sectors or industries such as aeronautical, transport, consultancy, banking and insurance, energy, telecommunication and, of course, digital, e-commerce and media. 3 billion internet users generate 50 Trillion objects (To) of data per second, a figure which is set to increase forty-fold by 2020. Today, the development of analytical skills for business and management has become a necessity. To respond to this need, HEC Paris is investing with a new joint Master Big Data for Business in collaboration with l’Ecole Polytechnique, set to begin in September 2017. It will provide students with the tools necessary to transform the data into useful knowledge and strategic decisions. After all, even Harvard Business Review has dubbed the occupation of data scientist “The Sexiest Job of the 21st Century”…
Part 3
Learning Algorithms: Lawmakers or Law-Breakers?
In everyday technologies, learning algorithms are becoming ubiquitous. They are even changing the way laws and regulations are produced and enforced, with law increasingly determined by data and enforced automatically. In his study, David Restrepo Amariles investigates how learning algorithms are developing SMART Law to improve the quality of regulations and their enforcement, and how this can be achieved without infringing on our civil liberties and the rule of law.
Part 4
Can Algorithms Measure Creativity?
Creative breakthroughs in art, music, and science profoundly impact society, and yet our understanding of creativity and how it is valued remains limited. To better understand creativity and how creative output is valued in society, a researcher is using a computational model, based on big data approaches, to evaluate the creative merit of artworks.
Part 5
Widening the scope of your CRM campaigns to take advantage of customer social networks
Marketing campaigns traditionally target individual customers, while ignoring their social connections. In a recent study, however, Eva Ascarza, Peter Ebbes, Oded Netzer, and Matt Danielson, had unique access to telecommunications data and a field experiment that enabled them to take a first-ever look into the effects of a traditional customer relationship marketing campaign on social connections.
Part 6
New Computer-Friendly Format Makes Financial Reports More Complex, Harder to Read
In a bid to make it easier for financial reports to be processed by computers, these must now be submitted to the U.S. Securities and Exchange Commission in a new language in addition to the traditional HTML format. In their recent study, Xitong Li, Hongwei Zhu and Luo Zuo explore how adopting the eXtensible Business Reporting Language (XBRL) is leading to more complex HTML-formatted financial reports. Instead of saving time and money, they find that submitting additional XBRL-formatted reports is costly to firms.
Part 7
How to prepare for the future by aggregating forecasts
Our ongoing machine-learning research at HEC Paris helps managers paint a clearer vision of the future. By programming a computer to aggregate lots of different forecasting methods – of which there are many – managers are no longer faced with the difficult decision of which one to choose.
Part 8
Why Consumers Stockpile Rather than Spend Loyalty-Program Points
Consumers tend to accumulate loyalty cards in their wallets and unused points on those cards, creating either liabilities or deferred revenue for retailers. A team of researchers has developed a model that explains this hoarding behavior and offers suggestions to improve loyalty reward program structures.
Part 1

Analytics in the Era of Big Data: Opportunities and Challenges

Data Science
Published on:

This special issue of Knowledge@HEC highlights several research projects and teaching initiatives at HEC Paris in the context of big data and business analytics. Nowadays it does not take much to convince students or managers alike of the importance of data for businesses. As Wedel and Kannan (2016) put it, “data is the oil of the digital economy”. Indeed, data is completely transforming organizations, and data-driven decision making is becoming more and more a part of a company’s core. In an increasing digital world, all of us are walking data generators, leaving long data trails: we have more data on everything.

Analytics in the Era of Big Data: Opportunities and Challenges - @Fotolia-shanghainesewang

Big data is often characterized by three (sometimes four or even five) V’s (e.g. Wedel and Kannan, 2016, Marr, 2016): Volume, Velocity, and Variety. More data was created in the past two years than in the entire previous history of mankind. At the same time, data is coming in at a much higher speed, often close to real-time. Furthermore, data nowadays is much more diverse, including not only numeric data but also text, images or video data to mention a few. The first two V’s are important from a storage and computational point of view, whereas the last V is important from an analytics point of view. 

On the other hand, several people have argued that big data is just a hype that will go away. When we analyze the popularity of the search term “big data” on Google, we find that the usage of “big data” as search term has grown explosively since 2008, but has stabilized since about 2015 (figure 1). Marr (2016) states that the hype around “big data” and the name may disappear, but the phenomenon will stay and only gather momentum. He predicts that data will simply become the “new normal” in a few years’ time when all organizations use data to improve what they do and how they do it. We could not agree more with him.
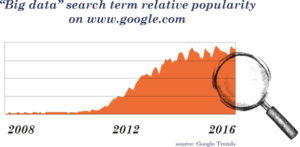
Big data trends on Google

But, understanding and acting on an increasing volume and variety of data is not obvious. As Dan Ariely of Duke University once put it, “big data is like teenage sex: they all talk about it, they all want to do it, but no one really knows how to do it”. Wedel and Kanan (2016) put it more formally and argue that companies have invested too much in capturing and storing data and too little in the analytics part of it. While big data is on the top of many companies’ agenda’s, few of them are getting value out of it today. Therefore, in this special issue we did not only want to highlight “big data”, but also the “analytics” part of it, as state-of-the-art analytics is necessary to get results from big data. 

We believe that a very basic lesson from “old-fashioned” marketing analytics also applies to the “new world” of big data, but is too often ignored: begin with an end in mind (Andreasen, 1985). If we do not know what decision we are trying to make, big data is not going to solve the problem: we are searching for the needle in a haystack without a needle. As Wedel and Kannan (2016, p115) note, the primary pre-condition for successful implementation of big data analytics is a culture of evidence-based decision making in an organization. Companies that are successful with big data analytics often have a C-level executive who oversees a data analytics center of excellence within the company. In such companies there prevails a culture of evidence-based decision making: instead of asking “what do we think?”, managers in such companies ask “what do we know?” or “what do the data say?” before making an important business decision. The big data analytics movement will also affect us at HEC Paris. We want to highlight three aspects, which are further discussed in this HEC Knowledge special issue. 

First, it will affect the education and training of our students. In this special issue, the article by Daniel Brown discusses several initiatives at HEC Paris regarding the education of our students. Particularly, it highlights a new joint master with Polytechnique on big data integrating topics in statistics/econometrics, computer science, and substantive business areas such as marketing or finance. This new initiative will further extent the course offerings in business analytics that HEC Paris already has.

Second, it will increase the breath of our research. In this special issue, we highlight four recent studies to make that point. The first two studies by Peter Ebbes and Valeria Stourm discuss new developments in the context of marketing analytics. Their studies show how combining a variety of data sources benefits customer relationship management. The next two studies by Mitali Banerjee and Gilles Stoltz’ develop new machine learning algorithms to analyze pictures and to generate forecasts. These two studies show how such algorithms can be used to judge creativity and to aggregate forecasts to help businesses make better decisions. Lastly, David Restrepo Amariles and Xitong Li discuss several issues regarding big data legislation and policies. David shows that big data practices and algorithms are not always compliant with the rule of law, whereas Xitong argues that certain big data requirements in firm financial reporting can make financial reports actually more complex and harder to read. 

Third, it will bring along opportunities for collaboration on problems of big data analytics between companies and researchers at HEC Paris. For empirical researchers at HEC Paris it is of increasing importance to be exposed to current business problems and data. At the same time, companies benefit from a close collaboration with researchers by getting access to state-of-the-art solutions and learning about the latest business analytic approaches in a field that is moving very rapidly. In fact, in several of our own past research studies, we have already successfully collaborated with companies on substantive data problems. Our collaborations have let to actionable insights for the company AND academic publications for the researcher(s), a clear WIN-WIN.


With this Knowledge@HEC special issue we highlight some of the exciting initiatives and research studies that are going on at HEC Paris. We hope that it inspires companies and alumni in the HEC Paris network to reach out to any of us with new data opportunities or big data analytics challenges, to further help to expand HEC Paris as a research institution!

Andreasen, A. R. (1985), “Backward” marketing research, Harvard Business Review (May issue) Marr, B. (2016), Big data in practice, Wiley, Chichester Wedel, M., and P. K. Kannan (2016), Marketing analytics for data-rich environments, Journal of Marketing, 80, pp.97—121.
See structure
Part 2

En Route For The “Sexiest Job Of The 21st Century"?

Data Science
Published on:

Big data has been a key challenge for many sectors or industries such as aeronautical, transport, consultancy, banking and insurance, energy, telecommunication and, of course, digital, e-commerce and media. 3 billion internet users generate 50 Trillion objects (To) of data per second, a figure which is set to increase forty-fold by 2020. Today, the development of analytical skills for business and management has become a necessity. To respond to this need, HEC Paris is investing with a new joint Master Big Data for Business in collaboration with l’Ecole Polytechnique, set to begin in September 2017. It will provide students with the tools necessary to transform the data into useful knowledge and strategic decisions. After all, even Harvard Business Review has dubbed the occupation of data scientist “The Sexiest Job of the 21st Century”…

En Route For The "Sexiest Job of the 21st Century"?

These Masters build on a series of courses already in place which have marked out HEC Paris as a leader in teaching the interdisciplinary world of data science. This so-called “fourth paradigm” in the scientific world is an expansion of the data analysis fields of statistics, predictive analytics and data mining. The likes of Peter Ebbes and Gilles Stoltz have been teaching these topics at HEC Paris for years. The two research professors and members of the GREGHEC Research Group continue to spearhead efforts to provide insight into data culled from both structured and unstructured fields.

Bringing Statistics Alive

“In teaching data science and statistics you should tailor your courses to suit both your personality and those of your students,” exclaims Gilles Stoltz, reclining in his new office in V building. “Because it’s important to galvanize them and convey your enthusiasm. Let’s face it, when they set the cursor, it brings alive a subject-matter that on paper doesn’t seem very inspiring at first.” The co-author of Statistique en Action  draws on exactly a decade of teaching at HEC Paris to explain his pedagogic approach. And, even if his colleague Peter Ebbes has been on the HEC Paris campus half those years, they both share similar beliefs on transmitting data science: “My classes are never one-way monologues,” explains Ebbes. “I quiz the students, we explore case studies together, the classes become conversations which keep them engaged. Okay, it’s sometimes tricky when I have 70 in the core classes, but I remain very keen on a participatory approach and we have some lively exchanges.”

Gilles Stoltz has been teaching his L3 statistics class since 2007 in a course with the logo “for today’s citizens and tomorrow’s leaders”. In the space of 20 hours he and his team of five-fellow statisticians present the fundamental theories to five classes of international students and eleven classes of French students. “I love this kind of teaching at HEC. It’s like doing theater! In theory they’re not too enthusiastic about statistics but by basing my teaching on a multitude of examples, I manage to gain their enthusiasm.” Stoltz shares with us one of the most popular practical cases amongst students. “Surprisingly, one focuses on the Iranian presidential elections of 2009,” he explains, “that’s when the Americans thought they had found a smoking gun proving the showdown between the incumbent leader Mahmoud Ahmadinejad and opposition candidate Mir Hussein Mousavi had been rigged. The Washington Post published an article, “The Devil Is in the Digits”, which analyzed the results using uniform distribution for the last digits of the vote but with an incorrect methodology. “They should have used the Chi-square test of goodness of fit! They would have seen that the P value is 7%, which is a typical value. So, as several statisticians pointed out at the time, the data is in no way a blatant proof of manipulation. The students like this example, it brings to life a situation which has an impact on the geopolitical world.”

A Multi-disciplinary Field Invites a Multiplicity of Students

Peter Ebbes focuses his teaching on business analytics, marketing research and marketing models. For the former professor at the prestigious Penn State University, there are three skills the students should aim at acquiring: “Advanced knowledge of statistics and math, IT and a substantive field like marketing”.“Many graduates master two of these three skills, very few manage to acquire all three,” he explains from his office in W1 building. “Added to this, it’s a real plus nowadays to acquire all-round knowledge on computer storage, moving data from one place to another. Acquiring all these is the big challenge we now face as we are challenged by this quantum increase in data.” The multidisciplinary nature of data science is reflected in the diversity of participants in Ebbes’ courses. “The catchment is really wide,” he points out, “We have some interesting characters in the MBA courses, there’s one from Google analytics, another with a PhD in philosophy, for example. The latter has provided some brilliant and unexpected insights into the case studies we’ve been working. This diversity really enriches our work.”

Important Backing From HEC Foundation

Could this variagated horizon be why there is an increased call for such data science and analytics experts like Peter Ebbes? In the United States alone, it is believed the gap in data scientists could be at 190,000. “There is a clear demand,” explains Ebbes, winner of the 2016 HEC Foundation best researcher award. “Businesses are hungry for specialists who can sift through their data. And, meanwhile, our research benefits from access to their raw data. It’s a win-win situation.”

The decision by HEC to purchase an eye-tracker has also helped researchers at the school better study consumers’ purchases online. “For example, what do people do with online reviews? Do they read them? How many? How does it influence their decisions?” asks Peter Ebbes. “With a PhD student, we’ve been overlaying the data with the eye-tracker which helps us know how and what to read.” Ebbes insists the help the HEC Foundation has given in funding such programs has been vital “It’s one of the most supportive in Europe, on a par to the support that institutions receive in the US,” he insists. The Dutch academic also stresses the positive impact HEC’s business connections has on research. “The school has a long history of collaboration with top multinational companies, it’s very important to work with them. I only wish French businesses were more aware of the opportunities there are to collaborate with us on research.”

Paris-Saclay University on the Data Horizon

The proximity of major companies are a clear asset in HEC’s teaching of data science, according to Gilles Stoltz. The teacher of Sequential learning and sequential optimization at M2 level believes the best way to transform the courses’ theories and field work into practical applications is through internships. ““Some of my PhD students in math have been hired by private companies under the CIFRE agreement,” explains Stoltz. “They have access to field data and have to develop theories based on their academic trainings and on-the-field experience. When they elaborate an idea for an algorithm they needs to code it, sometimes using all the big data framework and environment. The private sector provides the ideal setting for this. Not to mention the fact that their salaries are heavily subsidized for the companies!”

With this in mind, Gilles Stoltz believes the rapprochement between HEC Paris and the other establishments in Paris-Saclay University can only be positive.  But he is also enthusiastic about the developments developments at HEC Paris. “HEC wants to recruit a senior academic in business analytics, and we’re in a good state of mind. Statistical tools are being used in a multiplicity of classes, especially involving marketing and finance.” In the early 2010s, French affiliate professors of marketing had only a qualitative approach, Stoltz maintains. “Nowadays, we also have new younger academics like Daniel HalbheerCathy Yang and Ludovic & Valeria Stourm who are teaching marketing in a very quantitative way. Offering the two approaches is a real progress.” And the dynamic researcher concludes the department’s approach has made teaching data science a less dense and impersonal challenge than mirror courses on the other side of the Atlantic.

Related topics:
Data Science
See structure
Part 3

Learning Algorithms: Lawmakers or Law-Breakers?

Law
Published on:

In everyday technologies, learning algorithms are becoming ubiquitous. They are even changing the way laws and regulations are produced and enforced, with law increasingly determined by data and enforced automatically. In his study, David Restrepo Amariles investigates how learning algorithms are developing SMART Law to improve the quality of regulations and their enforcement, and how this can be achieved without infringing on our civil liberties and the rule of law.

Learning algorithms: lawmakers or law-breakers? David Restrepo-Amariles ©Fotolia-Zhi Difeng

Law is changing. Scientific, Mathematical, Algorithmic, Risk and Technology driven law (SMART-Law) is becoming a reality. The driving force behind this approach are advances in learning algorithms and the big data that they create. “We are currently experiencing a paradigm shift in the way that regulation and law functions in our society,” explains David Restrepo Amariles. “We are moving away from the familiar democratic system where laws were created and enacted by parliament and then enforced by judges and police. Here, rules and facts were separate. With SMART law, rules are drawn from facts and execution of the law is automatic.”

What are concrete applications of SMART law? 

Restrepo Amariles notes that SMART law is one part of the journey towards SMART cities, the first of which is Songdo in South Korea. “In such cities, everything is connected to the city system, and that system determines the rules and enforces regulation. For example, it is not possible to take the garbage out if it is not the right day, cars cannot drive faster than the speed limit, and in-car breathalysers prevent drunk-driving. This automated law enforcement means the law cannot be broken.” Even outside of SMART cities, there are many SMART devices in use that produce lots of data and are connected to the internet.

This data is then processed by algorithms, which are used to enforce legal rules. He notes, “In the UK, Her Majesty’s Revenue and Customs (HMRC) developed Connect, a software device used to help investigate tax fraud. This uses big data, collecting structured and unstructured data (such as that from social media and auction sites) to assess how well an individual’s lifestyle compares with their tax declaration. Today, approximately 90% of UK tax investigations are opened as an outcome of this software.” 


Lawyers need to apprehend the problem posed by smart law from a technical perspective in terms of computer science.


How do learning algorithms function?

Some of these algorithms can learn. “The Connect software was programmed by humans to collect data and confront certain legal rules. As it uses learning algorithms, it is able to evaluate, for instance, tax payers' response to HMRC interventions through the Analytics for Debtor Profiling and Targeting (ADEPT) and use this new information to recalculate behavior models and risk profiles. In the short term it might also able to identify that people who regularly buy goods on certain auction sites are less likely to declare VAT and flag them for investigation,” he explains. The key here is that the algorithm is not given this information but instead uncovers it all by itself.

Do learning algorithms abide by the rule of law?

Restrepo Amariles wanted to find out how learning algorithms can be used to improve regulation. He also investigated the effects they might have on our civil liberties. Looking at smart devices in five different fields — intellectual property, tax law, commercial and financial law, security and law enforcement, and corporate compliance — he focuses on issues that might arise related to data protection, privacy, discrimination and due processes. He points to the Uber algorithm as an example of how learning can lead an algorithm to become discriminatory: “It allocates car rides based on proximity and driver rating.

However, if a driver of a certain ethnicity is consistently poorly rated, the algorithm may learn this discriminatory conduct of consumers and exacerbate its effects, instead of helping to revert them. In the end, the learning algorithm has learnt to behave in a discriminatory manner, affecting its supposed neutrality.” This will mean that such an algorithm may no longer comply with anti-discriminatory laws.

He then asks the question, “How can we hold the algorithm accountable for this discrimination?” In truth, once it has learnt, it is not only difficult to hold an algorithm to account, but also to assess if its actions are indeed discriminatory. It may be possible to find out through reverse engineering or undertaking a ‘black-box’ experiment whereby the algorithm is supplied with information and you see how it responds.  

Certified: Rule of law compliant

 “We need to understand how to ensure algorithms are compliant with the rule of law, and also help make law more efficient,” Restrepo Amariles concludes. As this is a non-trivial task, he suggests that there should be a technical standard created that can be used across markets. Here, other algorithms could be created to test algorithm compliance with the rule of law. If they pass the test, they will be certified rule-of-law compliant. “Banning SMART devices to protect civil liberties would be dangerous and stunt innovation. Instead, a trusted system of certification should be created to protect individuals and industry.”

Practical Applications

Focus - Application pour les marques
Restrepo Amariles stresses a need for more data science savvy lawyers. “Lawyers need to apprehend the problem posed by SMART law from a technical perspective in terms of computer science. They also need to realize and understand that there is a very dramatic transformation taking place and the law must be adapted to take account of advances in computer science,” he states, going on to add: “It is key that the legal experts working in government, lawyers and in-house counsels receive more training related to SMART law.”

Methodology

methodology
Restrepo Amariles’ study is based on a literature review of contributions in computer science, economics, law and sociology. It focuses on the analysis of certain SMART law devices implemented in five fields of law: intellectual property, tax law, commercial and financial law, security and law enforcement, and corporate compliance. He looked at the possible implications for the rule of law of learning algorithms that use inverse deduction, back propagation, genetic programming, probabilistic inference, or Kernel machines. His assessment was based on the widely accepted principles of data protection, privacy, non-discrimination, and due process in common law and civil law countries, including in the European Union.
Based on an interview with David Restrepo Amariles on his working paper “Law’s Learning Algorithm: Making Rules Fitter through Big Data”.
See structure
Part 4

Can Algorithms Measure Creativity?

Data Science
Published on:

Creative breakthroughs in art, music, and science profoundly impact society, and yet our understanding of creativity and how it is valued remains limited. To better understand creativity and how creative output is valued in society, a researcher is using a computational model, based on big data approaches, to evaluate the creative merit of artworks.

Can algorithms measure creativity? Mitali Barnejee HEC Paris ©Fotolia-chetverikov

Creativity is a crucial aspect of human culture, yet it is hard to define and harder yet to measure. “The essence behind the term is being able to come up with new ways of seeing and doing,” HEC researcher Mitali Banerjee explains. Creativity not only defines the work of artistic pioneers or visionary scientists, but its different forms also animate the activities of businesses in industries ranging from technology to entertainment. “In some instances, such as the iPhone, creativity can involve recombining existing technologies in a new design; in other instances, creativity can involve designing new organizational processes,” says Mitali Banerjee. Apart from the difficulties of measuring creativity, little is understood about how creativity is valued in our society. Does everything creative become successful? “It is possible that some very creative works fail to rise to attention because of biases against such work or because of market structures,” the researcher points out. 

Measuring creativity and creative success on a large scale

Given that creativity is a key performance outcome in many fields, how does one go about evaluating the creative merit of an individual work? Past measures of creativity have often relied on expert evaluations, but, according to Mitali Banerjee, such evaluations tend to give an incomplete picture of the relationship between creative merit and success: “Asking experts to evaluate the creativity of even 100 artists entails a significant drain on their cognitive resources; having multiple experts might address the problem, but that involves introducing the experts' own subjective aesthetics and hence more noise in the measures.”

The need for a big-data approach is about more than overcoming the simple biases and limitations of experts: “Prior research suggests that creative work becomes famous or canonized. However, because of data limitations, such work has focused on a small set of creators, who often happen to be already the most celebrated ones,” says Mitali Banerjee. “With a computational measure of creativity, we can start examining if such results hold for a larger sample of innovators. Research in psychology and sociology suggests that even though we like the notion of creativity in principle, we are actually biased against creativity in practice. More often than not, new ideas and technologies encounter resistance rather than a red carpet.” Professor Banerjee decided to work with computer scientists to measure the creativity of paintings on a large scale and thereby gain a better understanding of how creativity is understood and valued in our society. 


There is a strong correlation between the expert and machine evaluations of creativity--so in that respect the computational measure reflects how we conceive of creativity.


A computational model for artworks

This novel measure of creativity relies on recent advances in statistics and computer science, which enable the exploitation of what is known as big data. The computation model was applied to visual features of more than 4,000 images of 55 early 20th-century artists. They include Natalia Goncharova, Pablo Picasso, Paul Klee and Robert Delaunay, who are associated with a range of abstract art movements including CubismFuturismOrphismGerman Expressionism and Rayonism. The researcher chose this period because it represents a paradigm shift in the history of modern art: “Until the 1900s, representational art had dominated much of the Western fine art world,” she comments. “Around then, we witness the emergence of several innovations in artistic style, broadly grouped as abstract art, which represent a distinct and radical break from the representational paradigm.”

Mitali Banerjee worked with several different algorithms with different computer scientists to extract features (some recognizable to human beings, like “ruggedness,” others recognizable only to computers without any such human interpretation), which in turn provided numerical representations known as feature vectors. (For the more enlightened, these approaches include unsupervised learning methods such as k-means clustering and artificial neural networks which are used to extract features vectors to represent a painting. Other methods such as k-nearest neighbors are used to classify the style and genre of the paintings). In parallel, Mitali Banerjee asked art historians to rate the artists' creativity, broken down along several dimensions: originality, stylistic diversity, abstraction, uniqueness and innovativeness. She then combined these scores into a single value (factor scores) for each artist, and compared the human measure and the machine measure of creativity.  

The complementarity of human and machine evaluations

Mitali Banerjee observed a strong correlation between the expert and machine evaluations of creativity. This correlation provides some validation of the computational measure, “so in that respect the computational measure reflects how we conceive of creativity,” she comments. The correlation between expert and machine evaluations was strongest when the machine was evaluating the most creative works of an artist (according to the machine). This suggests that human experts are thinking of the most creative work of the artist, even though Professor Banerjee had asked them to evaluate the average creativity of each artist between 1910-25.

Given the strong correlation between both types of measures, she plans to apply this approach to visual art on a larger scale, in particular to understand how creativity and fame evolve together. It may sound shocking to have a machine-based measure of something so ineffable as creativity, but Professor Banerjee likes to see it as a tool to complement human skills: “We humans are great at recognizing and evaluating complex products. We can learn from a relatively small set of examples whereas a machine needs more input, but machines can reveal what we have ignored because of our inherent biases. They can illuminate new ways of seeing. In order for these tools to give us meaningful insights it is important to take an interdisciplinary approach which integrates theories and tools from art history, computer science, psychology and sociology.”

Concerning the impact of her work, Mitali Banerjee speculates, “given how much our society already values creativity, and the demonstrable impact that creative ideas have on the economy and culture, insight into how creativity functions can impact how our institutions incentivize, recognize and support creativity.”

Applications

Focus - Application pour les marques
This research has immediate applications in understanding how products and producers are valued in the multi-billion-dollar art market. This approach can also be used to measure the creativity of other complex objects such as 3-D printed objects, video games and other consumer products. Furthermore, an art market is a market of ideas. Understanding how such a market rewards or ignores certain kinds of creativity can shed light on how other similar markets, such as scientific labor markets, can be refined to better recognize creative talent. Also, artists are in a sense the ultimate entrepreneurs who have to navigate considerable uncertainty while endeavoring to create something new. Understanding how some artists are more successful in achieving rewards for their creative output can tell us something about how entrepreneurs choose, implement and manage their objectives.

Methodology

methodology
For the machine evaluation of creativity, Mitali Banerjee used different machine vision algorithms to extract features from 4,175 images of 55 artists, creating a feature vector (a numerical representation of a painting), from which she computed a computational creativity score and then took the mean, mode, median, variance and extreme values. For the human evaluation, she asked four art historians to rate artists on a five-point scale along six dimensions, then combined these ratings into a factor score, and compared both types of evaluations.
Based on a written exchange with Mitali Banerjee and her research, including working paper “Understanding and valuing creativity using expert and computational measures of visual artists' output”.
See structure
Part 5

Widening the scope of your CRM campaigns to take advantage of customer social networks

Data Science
Published on:

Marketing campaigns traditionally target individual customers, while ignoring their social connections. In a recent study, however, Eva Ascarza, Peter Ebbes, Oded Netzer, and Matt Danielson, had unique access to telecommunications data and a field experiment that enabled them to take a first-ever look into the effects of a traditional customer relationship marketing campaign on social connections.

Widening the scope of your CRM campaigns to take advantage of customer social networks - Peter Ebbes HEC Paris  ©Fotolia-Jakub Jiràk

Our wide social networks are increasingly connected through social media and telecommunications. Technology enables us to create more lines of communication and our networks can be tracked. Peter Ebbes explains how these social networks could be of interest to marketing executives. “Traditionally, customers have a ‘customer lifetime value’ that predicts how profitable a company’s future relationship with them might be,” he says. “However, so far, marketers do not consider the value of a customer’s social network as a component of their lifetime value.” Ebbes and co-workers wondered what the value of social connections might be: “Could the network of an individual make them a more or less valuable customer?”

Collaboration between business and academia: a win-win 

The team embarked on a successful collaboration with the Seattle-based company Amplero, a big data and analytics firm, which gave the researchers unprecedented access to customer data. In their field experiment, they used telecommunications information from over a thousand individuals. “We staged a traditional marketing campaign whereby a randomised selection of prepay telephone customers received a message designed to increase their phone usage,” Ebbes explains. “Normally, we would only be interested in how successful the campaign was in relation to a control group who did not receive a message, but here we wanted to see if there was a ‘trickle down’ effect of that campaign through the target customers’ networks of social connections.”


Firms and industries are in a great position to take advantage of the increased profits that a network can provide.


Marketing affects the social network

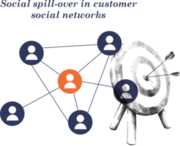
Only the target customers’ primary connections who use the same telephone provider were tracked. To be considered a connection, two calls had to have been made, to or from the target, in the four weeks prior to the experiment. Ebbes discusses the team’s findings: “The connections of those that received the campaign were found to be less likely to suspend their contracts and more likely to increase their activity, relative to the control group,” says Ebbes, who goes on to add: “This is interesting as the connections themselves were not targeted and did not receive a marketing message. As the experiment was randomised, we can say that the campaign caused an effect on both the targeted customer and also their connections. So, for the first time, we demonstrate that traditional marketing campaigns have a social spill-over effect.”

A social multiplier

As a consequence of the marketing campaign, targeted customers increased their overall phone usage by 35%. Individuals connected to targeted customers increased their usage by 10%. This increase was not seen in individuals connected to the control group. From this data, Ebbes estimated a social multiplier of 1.28. He explains, “We see that the campaign has a spill over effect of 28% on the usage of the target customer’s connections. This is something that could be utilised by businesses to increase the profitability of targeted customer relationship marketing.” The team then altered their analysis approach and showed that increased activity among the non-targeted but connected customers is driven by the increase in communication between the targeted customers and their connections. This means that the marketing campaign propagated through the network to affect the non-targeted customers. Consequently, these customers also became more valuable to the company even though the company did not spend a penny on targeting them. 

Networks increase potential profits for firms 

Ebbes emphasizes that this study is applicable to all businesses with clear network externalities, which have the ability to target individual customers and observe their social connections and activity. “Firms and industries that offer products using networks or whose services require underlying networks are in a great position to take advantage of the increased profits that a network can provide,” he says. “At the moment, these include companies with stakes in telecommunications, online multiplayer games or file-sharing services like Dropbox, but there are also potential gains for traditional businesses."

Applications

Image - Social Networks
“Our research should encourage businesses to take advantage of customer networks to increase their profits. It enables marketing managers to measure customer lifetime differently; by considering social networks, they can now consider the customer, not only as an individual, but as a portal to a larger customer base.” When planning marketing campaigns, business can use Ebbes’ work to improve targeting. He adds, “Firms need to wake up and grab that extra cash lying on the table. Ignoring their customer’s social networks means that a pool of potential profit is untapped.” 

Methodolgoy

methodology
Ebbes et al. ran a field experiment using data from a telecommunications provider. 656 pre-pay telephone customers were selected at random to receive the same marketing message to entice them to top-up their phone credits. A control group of 385 individuals received no such message. Traditionally, a marketing campaign would evaluate the behaviour of those that received the message, but here, Ebbes and colleagues focused on the actions of the network of the targeted individuals. The network was made up of primary connections that the targets call or receive calls from, and who use the same service provider. Through empirical analysis they demonstrated a substantial increase in usage among target customers. Importantly, the team also saw a 10% increase in usage among the connections of targeted customers, who were not themselves targeted by the campaign.
Based on an interview with Peter Ebbes on his paper “Beyond the target customer: social effects of CRM Campaigns”, co-authored with Eva Ascarza, Oded Netzer, and Matt Danielson (Journal of Marketing Research, in press).
See structure
Part 6

New Computer-Friendly Format Makes Financial Reports More Complex, Harder to Read

Information Systems
Published on:

In a bid to make it easier for financial reports to be processed by computers, these must now be submitted to the U.S. Securities and Exchange Commission in a new language in addition to the traditional HTML format. In their recent study, Xitong Li, Hongwei Zhu and Luo Zuo explore how adopting the eXtensible Business Reporting Language (XBRL) is leading to more complex HTML-formatted financial reports. Instead of saving time and money, they find that submitting additional XBRL-formatted reports is costly to firms.

New computer-friendly format makes financial reports more complex, harder to read. Xitong Li ©Fotolia-Big data concept 3D-MaZi

In 2009, the U.S. Securities and Exchange Commission began imposing a new financial regulation on public firms. After a three-year, three-step phase-in, all firms listed on U.S. stock exchanges must now submit their financial reports in not only HTML but also the newer eXtensible Business Reporting Language (XBRL). “Public firms are required to disclose their financial situation and make this information freely available,” Xitong Li explains. “Financial reports were traditionally submitted and stored in HTML format that can be opened on an internet browser and is easy for humans to read and understand.” The Securities and Exchange Commission adopted the new ‘language’ to adapt to the demands of an increasingly digital world: reports are now filed in a format that can be easily processed by computers, which are expected to be more accurate, faster and lower cost than their human counterparts. 

A counterproductive regulation?

Li and co-authors were concerned that this new regulation might affect the overall readability of HTML-formatted human-readable financial reports and wondered what the consequences of this might be. “Using XBRL means that information will be easier and cheaper to process,” he explains. “Firms might anticipate this and add more information to reports, making them longer, more complicated and in the end, they actually become harder to read.” If this scenario is the reality, Li suggests that the regulation could be acting contrary to its intended purpose. “Now, firms must file two reports instead of one, which is time consuming and costly,” he says. “Some think that this might mean individual reports are rushed and less carefully prepared, which also reduces their readability.”


The Securities and Exchange Commission adopted the new ‘language’ to adapt to the demands of an increasingly digital world.


Three-phase introduction of XBRL financial reports

In the years before the regulation was enacted, all firms would experience parallel trends in the readability of their reports, no matter their share value. In phase one of the regulations’ introduction that began in 2009, firms with share value in excess of $5 billion were required to file their financial reports in both formats. In 2010, phase 2 was initiated and firms with share values between $5 billion and $700 million adopted XBRL. Phase 3 followed in 2011 whereby all remaining firms had to adopt both report formats. “We compared the readability of reports from the high value phase 1 group of firms before and after the regulation was implemented, between 2008 and 2009, with those of firms from phase 2, who were only required to submit financial reports in HTML format in those years,” Li explains.

New regulation brings readability reduction 

The team noticed a dramatic reduction in readability of HTML-formatted reports between 2008 to 2009 for the high share value firms that were submitting in both HTML and XBRL formats. This was not seen with the firms who were not yet required to write reports in XBRL. “We used a tried-and-tested DID design method of analysis to conclude that this increased complexity and decreased readability of the financial reports is due to the new regulation,” Li concludes. “The regulation has unintended and undesirable side-effects.” Li is also quick to mention that the timing of the introduction of this regulation coincided with a period of financial crisis: “The study was carried out to control for the impact of the crisis. Even when this is factored in we still see that the regulation increases the complexity of the financial reports.”

Added complexity could bring investment losses 

HTML-formatted financial reports are relatively easy for humans to read and so are still in use by most analysts and investors even after the introduction of XBRL. These findings are not good news for the U.S. Securities and Exchange Commission, who implemented the regulation with the purpose of improving access to information. At present, reports are not produced, processed and exported by computers alone, and human manual intervention makes the process unintentionally messy. With less readable reports, firms will receive less attention from the public and investors, who cannot easily understand the figures. Li warns of the financial impact this could have on firms: “When an investor cannot read a firm’s financial report, they won’t understand its financial situation and will be less likely to invest in their stock.”

Applications

Focus - Application pour les marques
“Firms, investors and the Securities and Exchange Commission need to realise that this policy has unintended and undesired effects that make financial reports more complex and harder to read,” stresses Li. “They need to create mitigating strategies.” He proposes that firms should dedicate more resources to preparing financial reports, both in HTML and XBRL. He adds, “Investors should not rely on the HTML version of the report being understandable and might have to pay more attention to other channels a firm uses to disclose financial information, such as social media.” He concludes, “This will affect smaller business most as they do not have the resources and analysing power to give enough attention to the XBRL report.”

Methodology

methodology
Li, Zhu and Zuo used a difference in differences (DID) method of analysis to examine and compare the readability of firms’ financial reports in 2008 and 2009. Prior to 2009, the U.S. Securities and Exchange Commission required that financial reports only be submitted in HTML format, but after this date regulation mandated that public firms submit their reports written in both HTML and the eXtensible Business Reporting Language (XBRL). In 2009, phase one of implementation had begun and firms with share value of over $5 billion submitted reports in both formats. Smaller firms were required to adopt XBRL a later year. Li and co-authors’ analysis uncovered a dramatic reduction in the readability of the HTML-formatted human-readable reports of firms with share value over $5 billion in 2009, compared to those that were still only required to submit HTML versions in that year. The team attributed this reduced readability and increased complexity to the XBRL adoption imposed by the new U.S. Securities and Exchange Commission regulation.
Based on an interview with Xitong Li and his working paper “The Impact of XBRL Mandate on Readability of HTML-formatted Financial Reports”, co-authored with Hongwei Zhu and Luo Zuo.
See structure
Part 7

How to prepare for the future by aggregating forecasts

Economics
Published on:

Our ongoing machine-learning research at HEC Paris helps managers paint a clearer vision of the future. By programming a computer to aggregate lots of different forecasting methods – of which there are many – managers are no longer faced with the difficult decision of which one to choose.

How to prepare for the future by aggregating forecasts by Gilles Stoltz ©Fotolia-faithie

Whether used to predict weather patterns, determine how exchange rates might fluctuate, or in which direction consumer preference might evolve, accurate forecasts are key to success in business. In many industries, sufficiently large companies hire data scientists to provide such predictions while others buy forecasts as a service. 

But while decision-makers would often like their forecasting experts to come up with one single accurate prediction, in reality even just one expert can think of several forecasting methods, each of which usually requires tuning and some technical choices. This means companies are spoiled for choice when deciding which methods to choose. 

Such methods include traditional statistical models, whereby past data is modeled to come up with predictions. Then there are machine learning approaches, where a computer by way of an algorithm is able to automatically find hidden data in statistics without being told directly where to look. Within machine learning techniques there are also different methodologies (for example ‘random forests’, which uses decision trees, or ‘deep learning’ using multi-layered transformations of the data). Managers, when faced with a whole cloud of forecasts and what they sometimes see as too much choice, perceive this as a problem. 

But there is a solution. As in life outside of business, diversity can be an opportunity and instead of selecting one expert or one forecasting technique at all cost, there are ways to aggregate the cloud of prognosis into a single meta-forecast. This work (itself a form of machine learning) can be conducted by computers and is both automated and safe.  

At HEC Paris we have developed forecast aggregation tools to help businesses make decisions. So far we have used these in various industries: to forecast exchange rates at a monthly rate and with a macro-economic perspective [1]; to forecast electricity consumption [2] with France’s largest electricity provider, EDF; to forecast oil production (on-going); and even to forecast air quality [3]. 

So how does it work? First, we must design all the automatic processing of expert forecasts. We do this by creating formulae and algorithms, associating each expert with a weight and have the weights vary over time depending on the past performance of each individual. Once programmed, a machine then uses the algorithms to perform the desired aggregation automatically as a black and does not require human supervision. 

This way of aggregating expert forecasts performs well both in practice (i.e. when used for practical purposes) and in theory, and comes with what we call ‘theoretical guarantees of performance’, which is what makes it so safe. At HEC, as well as other research centers around the world, we have produced aggregation techniques that perform almost as well as, say, the best expert, and even the best fixed (or linear) combinations of experts. The important thing it to gather forecasts from a multitude of experts and we believe this is beneficial, as it increases the chance that at least one of them will be good. Of course aggregating forecasts does have its limitations. Firstly, constructing or getting expert forecasts that actually exhibit diversity is not always an easy task, as experts are often clones of each other and predict similar tendencies.

Secondly, this black-box aggregation of expert forecasts that comes from various sources (human experts, statistical models, machine learning approaches) does not attempt at all to model the underlying phenomenon, which is in strong contrast to more classical statistical or econometrics approaches. With aggregation, all efforts are put into forecasting performance and nothing is invested on the modeling. Of course this works fine if the final decision-maker only wants to make good decisions and not  try to understand her/his environment!  

As we continue to develop this aggregation solution at HEC, which is both on the theoretical and practical side, we have begun approaching various companies for R&D contracts and/or proofs of concepts. Our aim is to look at business problems even more closely related to the ones studied at HEC Paris, such as forecasting volumes of sales to manage the supply chain. Perhaps our work will help put decision-makers’ minds at ease when they face what can be an overwhelming choice of forecasting options.

[1] Christophe Amat, Tomasz Michalski and Gilles Stoltz, Fundamentals and exchange rate forecastability with machine learning methods, 2015.  [2] Marie Devaine, Pierre Gaillard, Yannig Goude, and Gilles Stoltz, Forecasting electricity consumption by aggregating specialized experts; a review of the sequential aggregation of specialized experts, with an application to Slovakian and French country-wide one-day-ahead (half-)hourly predictions, Machine Learning , 90(2):231-260, 2013 [3] Vivien Mallet, Gilles Stoltz, and Boris Mauricette, Ozone ensemble forecast with machine learning algorithms, Journal of Geophysical Research , 114, D05307, 2009
Gilles stoltz
Gilles Stoltz
Affiliate Professor
See structure
Part 8

Why Consumers Stockpile Rather than Spend Loyalty-Program Points

Data Science
Published on:

Consumers tend to accumulate loyalty cards in their wallets and unused points on those cards, creating either liabilities or deferred revenue for retailers. A team of researchers has developed a model that explains this hoarding behavior and offers suggestions to improve loyalty reward program structures.

Why consumers stockpile rather than spend loyalty-program points - Valeria Stourm HEC Paris ©Fotolia-freshida

Whether grabbing a coffee-to-go at the shop down the street or flying halfway across the world, consumers tend to enroll in loyalty programs for just about every possible purchase. On paper, it's a win-win relationship: the customer gets a tenth coffee for free or a free flight against accumulated miles, and the company gets repeat business. These schemes should be all the more successful as “rewards reinforce positive purchase behaviors,” says Valeria Stourm, who studies such loyalty programs.

But, in fact, consumers use their points a lot less than might be expected. One third of the $48 billion in rewards issued in the United States every year are never redeemed. And we’re not just talking about complicated programs whereby a threshold of so many points (typically, airline miles) needs to be reached to obtain a specific reward. Even simple, boring, a-point-for-a-dollar at the supermarket programs see customers stockpile points instead of using them to instantly reduce their basket price. Hoarding is neither particularly profitable for the customer (unredeemed points may expire, depending on retailer rules) nor for the business (outstanding points are "stuck" on the balance sheet). So why don't customers systematically collect the shopping rewards to which they are entitled? Faced with that puzzle, three researchers, Valeria Stourm, Eric T. Bradlow and Peter S. Fader, developed a model to understand why customers persistently stockpile points in so-called “linear programs” (the kind designed explicitly not to encourage stockpiling, with free-to-use points). 

Why consumers accumulate loyalty points

The novelty of the model presented by the team of researchers in their paper is that it brings together three different approaches to explaining why customers of linear programs stockpile: economic, cognitive and psychological motives. A potential economic motivation is that customers forgo the opportunity to earn points on purchase occasions in which they redeem. The second is a cognitive incentive: the transaction comes at a “cost”, albeit not a financial one. “Perhaps customers find it annoying to take out their loyalty card and ask the cashier to redeem,” suggests Valeria Stourm. The third, more sophisticated explanation is psychological. Based on mental accounting, this explanation supposes that we have different mental slots for different currencies, even when they are of equivalent monetary value; for example, poker chips in a casino as opposed to cash, or money budgeted for leisure as opposed to money budgeted for groceries. In this context, it means that customers do not perceive cash and points equally. With this model, a $10-purchase made by paying the equivalent of $3 from the customer's points account and $7 from his or her cash account would be analyzed as follows: The $3 are a loss to “points wealth” and the $7 to “cash wealth”. By redeeming, the customer also loses the opportunity to earn $0.10 in points (or whatever percentage of the price is set by loyalty program rules). Such debits and credits are evaluated separately as gains and losses in each mental account. It may sound silly to assess the use of points in terms of loss or pain, but the researchers did hear one customer from a linear program express sadness about point redemption in an interview: “It makes me feel sad because I don't have any points left on my card.” In addition, the researchers relied on prospect theory, which assumes that losses and gains are perceived differently when making choices. “Put simply, losses loom larger than gains, so the pain of losing $5 feels greater than the pleasure of winning $5,” says the researcher. 


It's more strategic to encourage redemption, and loyalty, if only from a purely marketing perspective.


Empirical confirmation from retail shoppers

The researchers estimated their statistical model on data from a large supercenter chain in Latin America. By tracking the purchases of a cohort of more than 300 customers over three years, they indeed found that many were sitting on a goldmine of unclaimed points: even though no minimum is required to redeem points, only 3% of all purchases had redemptions associated with them, even though redeeming could reduce basket price by 30% on average. “It doesn't mean customers don't care about the loyalty program, since they still show their card to earn points, and 40% of the customers in the panel eventually redeemed during the observation period,” comments Valeria Stourm. She and her co-authors hypothesized that customers waited until they had enough points for the loss in terms of points to be compensated in terms of cash (redeeming attenuates the pain of cash loss). And indeed, when testing the statistical model, the researchers found that their analysis based on dual mental accounts was relevant to forecast customer behavior. Cognitive motivations (fixed costs) also helped to explain observed customer purchase behaviors, but there was much less evidence to support explanations based on economic motivations.

Encouraging customers to redeem points?

Having thus identified the cognitive and psychological drivers of redemption behavior, the researchers were able to offer suggestions for companies to rethink their loyalty programs. Valeria Stourm remained cautious, however, explaining that the results of the policies evaluated in their study would be applicable to those particular cases only. The policies compared included offering rewards points for every basket price, regardless of redemption choices (an economic policy), automating redemption (cognitive policy), for instance by automatically reducing the customer's basket price if his or her stockpile is greater than 15 points, and a psychological policy that allows customers to redeem up to 100% of the basket price instead of the current 50%. But is it actually strategic to prod customers in that direction, since redemption comes at a financial cost for companies? Valeria Stourm admits that it's debatable: “From an accounting perspective, an unredeemed point is a cost you don't incur, but it's also a liability or deferred revenue on the balance sheet.” In her opinion, it's more strategic to encourage redemption, and loyalty, if only from a purely marketing perspective. “Customers who experience rewards may become even better customers,” she says.

Applications

Focus - Application pour les marques
“Managers have contacted me since the article was published who also observe their customers stockpiling large amounts of points. Our work has inspired them to re-evaluate the design of their loyalty programs,” says Valeria Stourm. One way of framing redemption as a gain rather than a loss would be to let customers earn bonus points on such purchases. The main way to encourage redemption though is to increase redeemable points, since data suggest that the differences in the mental accounts of cash and points lead the benefits of redeeming to grow faster that the costs, so customers may redeem more frequently.

Methodology

methodology
The researchers built a theoretical mathematical model uniting economic, cognitive and psychological explanations for customer behavior regarding loyalty programs. Using advanced statistical analysis, they then demonstrated its performance empirically, using a retail data set of 10,219 purchase occasions of a cohort of 346 customers from January 2008 through July 2011.
Based on an interview with Valeria Stourm and on her paper “Stockpiling points in linear loyalty programs,’ co-written with Eric T. Bradlow and Peter S. Fader, Journal of Marketing Research Vol. LII (April 2015). This publication was honored with the highly prestigious 2016 AMA Donald R. Lehmann Award for "outstanding dissertation-based article published in Journal of Marketing Research" and was named Finalist for the 2016 Paul E. Green Award, which is given each year to the best article published in Journal of Marketing Research.

Related content on Data Science

e commerce - vignette

Photo credit: CardMapr.nl 

Data Science

Click, Click, Boom! New Algorithm Set to Boost Revenue for Online Retailers

By Sajjad Najafi

Photo Credit: NaMaKuKi on Adobe Stock

Data Science

How Do Algorithmic Recommendations Lead Consumers to Make Online Purchases?

By Xitong Li

Finance
Why Do We Share Our Personal Data?
Johan Hombert
Johan Hombert
Associate Professor
facial recognition thumbnail
Artificial Intelligence

“A $%^* Sexist Program”: Detecting and Addressing AI Bias

By Christophe Pérignon

Operations Management

How Can We Force Companies To Keep Our Data Safe?

By Ruslan Momot

clicking on news online - thumbnail
Finance

How Big Data Gives Insight Into Investor Uncertainty

By Thierry Foucault

Subscribe button for Knowledhe@HEC newsletter

Newsletter knowledge

A monthly brief in your email box and 3 issues of the book per year.

follow us

Insights @HECParis School of #Management

Follow Us

Support Research

Our articles are produced thanks to our reader's support